How Mapping, Satellite Technologies Can Help Pick Ideal Sites for Solar
Solar energy installations have seen steady growth in the past decade, with the World Energy Council reporting a global increase from 14 to 227 gigawatts of installed electric power from 2008 to 2015. In the United States alone, solar has grown at an average rate of 59 percent; the 53 gigawatts installed in the U.S. provides enough electricity to power 10.1 million homes, according to the Solar Energy Industries Association.
With incentive programs such as the U.S.’s Solar Investment Tax Credit, many of the installations are taking place in the business sector. As more companies consider building solar installations on their campuses, NC State graduate student Missy Catlow wanted to explore how new technology might help evaluate potential sites.
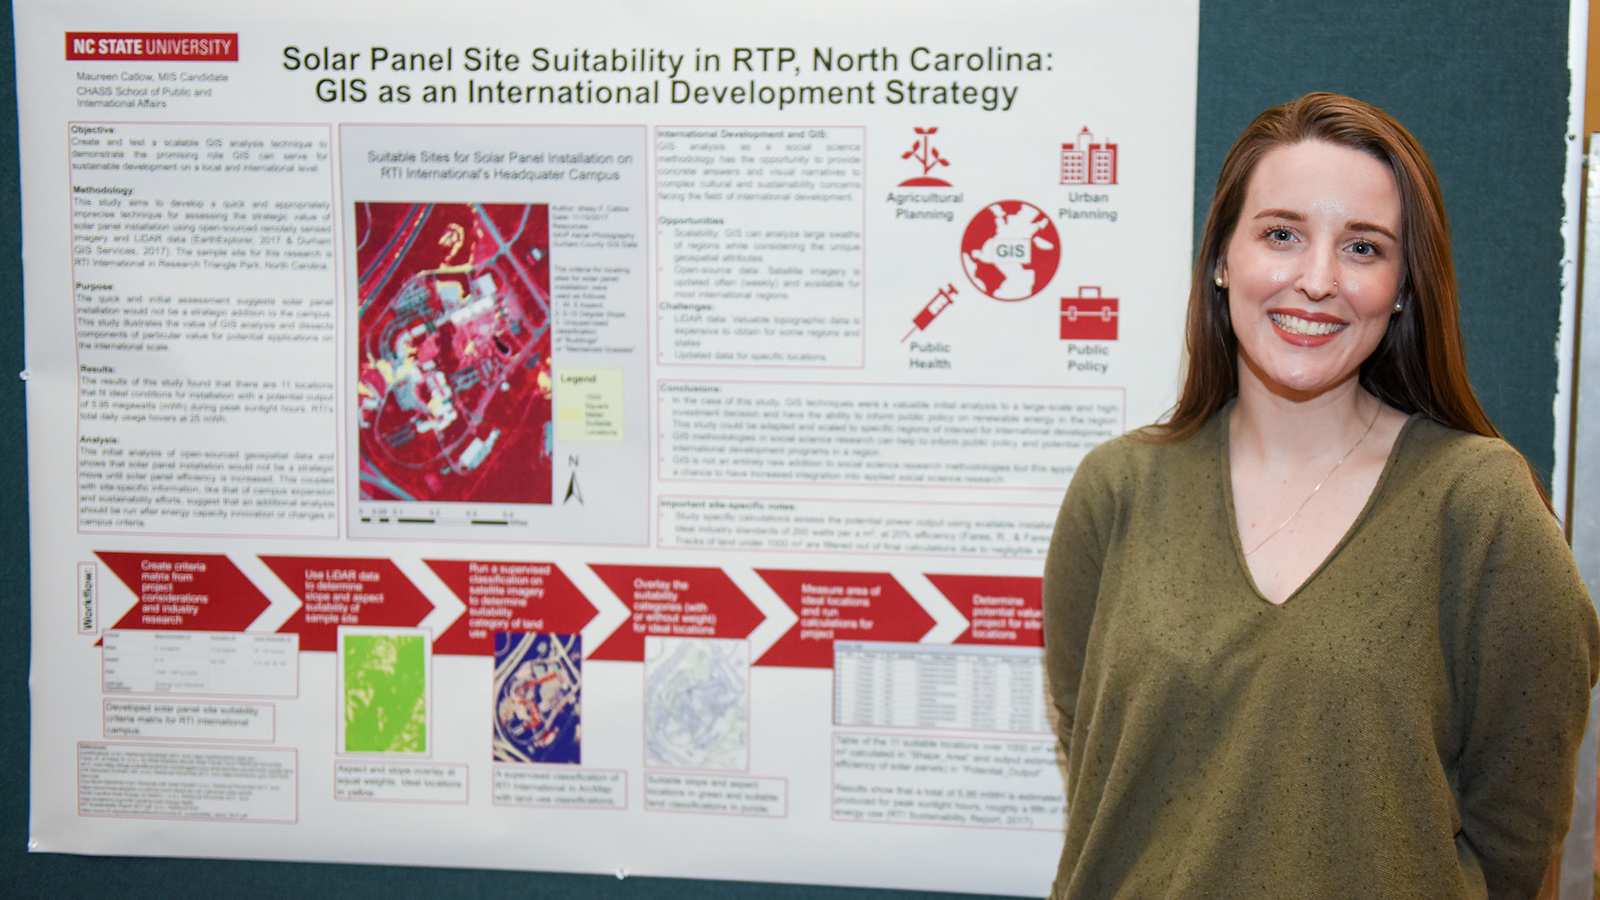
Catlow, a recent graduate of the Master of International Studies program, studied how LiDAR mapping technology and satellite imagery could be used to determine how suitable land is for a potential solar installation. Focusing on a specific site in the Research Triangle Park, Catlow hopes to highlight the value of this technology for larger international projects.
We caught up with Catlow about her study, which she presented at the 2018 NC State Graduate Student Research Symposium. Her research poster won second place in the Social Sciences and Management category.
Q: What drew you to this research? How did you get interested in this topic?
When I think about my research projects, I want to find methods of using technology and data to create meaningful impacts to improve the world around me. For this project, I was interested in renewable energy and what that might look like as a part of a development strategy.
Historically, there is a theme in development of cutting before measuring and that tends to hurt more than help. I wanted to find a way that evaluated an idea and confirmed its usability before implementation to address any negative or unintended impacts.
In the case of this research, I used LiDAR data and satellite imagery for RTI International in Research Triangle Park to assess the value of solar panel installation as a development strategy for renewable energy.
Q: What is LiDAR and what potential applications does it have for land suitability analysis?
LiDAR (Light Detection and Ranging) is remotely-sensed data that collects the topography of a location. This data, while open-source for North Carolina, is very expensive to collect.
The applications for this type of data range as wide as a researcher’s imagination. It can be used to find elevations in a specific location or used to identify change over time. In my research, I utilized Durham County LiDAR data to find suitable slopes and aspects from the collected elevations for my site and cross-referenced that information with slopes and aspects that would be suitable for solar panels.
Q: What questions were you hoping to answer with your study?
My research had two objectives. One was to identify appropriate areas of installation for solar panels at the site. The second aimed to determine if installation of these solar panels would be in the best interest of the site. I created and completed this research to illustrate what an initial assessment of solar panel installation might look like for an organization or business. The goal is to scale and customize this research methodology to be used for development or rebuilding efforts for larger site locations.
Q: How did you conduct your research?
My research consisted of three parts:
- Research on Solar Panels: First, I identified the conditions for solar panel installation and in what situation the most energy would be produced per square meter.
- Criteria Matrix: After collecting the appropriate conditions for solar panel installation and energy output, I created a criteria matrix that would inform the geoprocessing steps it would take to identify the locations that met the ideal locations for solar panel installation and energy production.
- Cost Assessment: After identifying the potential locations, I calculated the total area in square meters and estimated the total energy output that the installation of these solar panels would have.
A collaborative and interdisciplinary approach that mimics the technical and social perspectives in my research will create better solutions and data-driven answers that push the world toward a better future.”
— Missy Catlow
Q: What did you find? What are some potential applications of this research?
My research concluded that while there was space to install the solar panels, the energy output would not significantly address the current energy use and cost of RTI International’s daily output. The panels would address about one-fifth of the total energy usage of the site for the three summer months of the year, with declining rates on either side. This assessment determined that solar panel installation would not be in the best interest of the organization and that other methods to push toward renewable energy should be explored until solar panel technology is more advanced.
I created and completed this research to illustrate what an initial assessment of a development effort might look like using available spatial data. Leveraging spatial data for the forecasting and planning of development projects can inform strategies that minimize unintended negative effects and maximize meaningful impacts to improve the standard of life in any community. A collaborative and interdisciplinary approach that mimics the technical and social perspectives in my research will create better solutions and data-driven answers that push the world toward a better future.